A Series A enterprise AI platform had just raised $20M. They had a working enterprise motion — good close rates, strong product — but the sales cycles were long, and the board wanted faster growth. A well-funded competitor was gaining ground. So leadership decided to go after mid-market.
They hired over 20 reps in about three months. SDRs, AEs, the standard playbook. Pulled thousands of contacts from ZoomInfo using basic filters — industry, headcount — loaded them into HubSpot, set up cold email infrastructure, and started dialing.
Their Head of GTM was squeezed from both sides. The CEO expected returns on a major headcount investment. Twenty new hires looked to him for direction — who to call, what to say, why these accounts. He didn't have good answers because the company had never actually defined a mid-market motion, not really. The enterprise team had years of knowledge about their buyers. The mid-market team had a ZoomInfo export and a mandate to move fast.
So everything was either made up on the spot or borrowed from the enterprise motion. Neither really worked. Reply rates were low. Cold calls went out in no particular order to what might as well be random companies. Hundreds of dials a day into a list of thousands, with no scoring and no shared understanding of who they were actually trying to reach.
They tried adding email personalization. Didn't matter — the underlying messaging didn't resonate because the team hadn't figured out who they were talking to or why these companies should care.
They booked some meetings. With the wrong accounts, though. The mid-market team's first deals closed after three months — on companies that weren't a good fit and would cost more to service than they were worth. Meanwhile: 20 new hires on premium comp (they'd overpaid to hire fast), months of ramp with nothing to show, and a growing pile of misfit deals.
The fallback plan was ugly — kill outbound, move the SDRs to enterprise, try marketing-led for mid-market. Operationally survivable. But it would tell the board that the mid-market bet (their answer to the competitive threat) had failed.
We started with the question their reps couldn't answer: which of these thousands of companies are actually worth calling, and why? In other words, how do we know where companies are in the buying process, and what's the right approach for each one?
Nobody had a clear answer. So that's the first thing we did. We ran several working sessions with their leadership and top reps to identify the specific data points that, when researched, would give you a real picture of whether a company was likely to have the problems their product solves.
Not just firmographics (they had that already) — things like what tools they were running for customer support, how their team was structured, what their public-facing support experience looked like. Each data point had a defined weight and a written rationale for why it mattered. We argued about those weights. We manually re-ran the pipeline on sample companies to check whether the output matched what a good human SDR would conclude if they spent an hour researching the same account.
Define the ICP scoring model: identify data points, assign weights, validate against real accounts with experienced reps.
Then we built a system that could run this research automatically (including grabbing screenshots from customers' sites) and score any company against the ICP we'd defined together — a fit score from 1 to 100, plus a short explanation of what signals were present and what they meant. We scored roughly 12,000 companies from their HubSpot in two days.
The result was a normal distribution, of course, so their RevOps lead took the top segment, split it among reps using HubSpot lists that synced directly into the outreach tool. The workflow stayed the same — reps still used the same tools, same sequences. But now, before picking up the phone, they could read a document explaining why this company was on their list, what challenges it likely faced, and what mattered to them.
That changed the nature of the conversation entirely.
Build the automated research & scoring system. Score 12,000 companies. Integrate into existing HubSpot workflows.
Four weeks total from kickoff to live system.
Within the first quarter, the pipeline increased 1.5x. The team stopped hiring — not because of a freeze, but because the reps they already had started producing at the level leadership had originally planned to reach by adding more headcount. Monthly tool spend dropped from $20K to $10K. Half the tools they'd been paying for became redundant once the system handled what those tools were doing manually and badly.
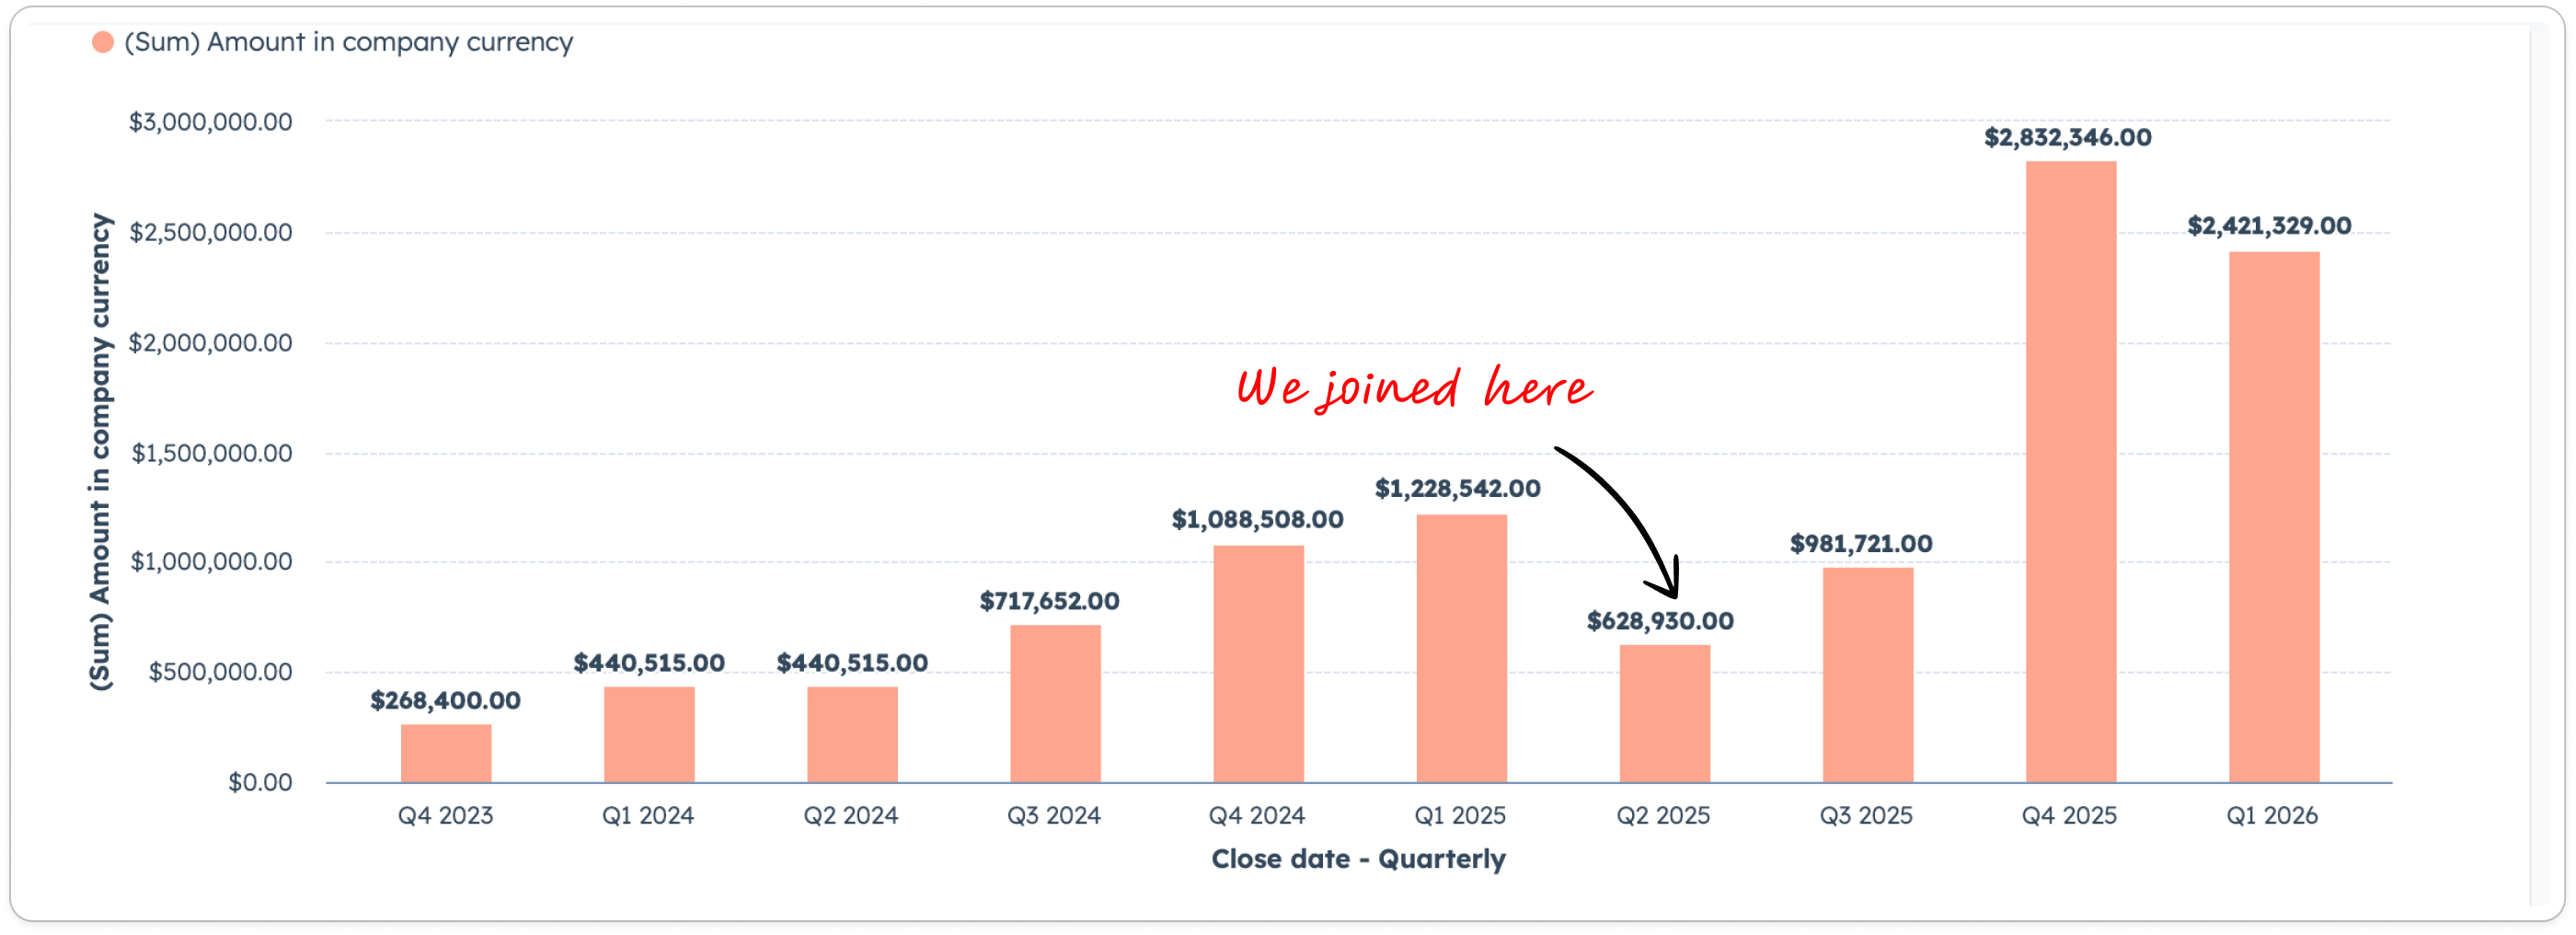
By year-end, the mid-market team generated over $5M in revenue — more than double what the enterprise produced over the same period.
A motion that was weeks away from being shut down became the company's primary revenue engine.
As the system ran, it improved itself. It tracked which data points actually predicted fit and adjusted the weights, so the second month's targeting was sharper than the first. The team started using the research documents not just for outreach but to understand their ICP more deeply — what specific characteristics made a company worth pursuing and why.
When they expanded into new verticals, they didn't start from scratch. They had a foundation.
Reps went from quantity to quality. Fewer calls, better conversations, higher output. The system learned from what worked. The team learned from the system.
Your conversion rates are leaving revenue on the table. Find out where — and what it's costing you.
Get in Touch →